Blog
In CCData's latest Market Spotlight blog, we delve into key aspects of Ethereum, especially with the upcoming Ethereum Merge. We explore the Merge's implications, current market conditions, and the Consumer Price Index (CPI). The spotlight includes a brief history of Ethereum, analysis of BTC vs. ETH market dominance, and Ethereum's issuance changes pre and post-merge.

In our latest Market Spotlight, we examine everything Ethereum as we approach the day of the merge. This week we examine:
This blog was created using CCData’s market-leading real-time, historical, and derivatives data, as well as our enhanced order book offering. If you would like to trial our data, please register here.
September got off to an eventful start with the cryptocurrency markets retracing back from their earlier rallies following the CPI inflation announcement on Tuesday.
The index showed signs of recovery as inflation declined for the third consecutive month to 8.3%. However, the markets reacted poorly to the heavier-than-forecasted figures and indications of a 100bps interest rate hike with Bitcoin and Ethereum dropping 9.94% and 8.27% on the day respectively.
Earlier in the month as we edged closer to the Ethereum Merge, the price action reflected the interest of traders and investors in the asset with ETH/BTC hitting its yearly high on September 8 at 0.08463.

Meanwhile, the Ethereum market dominance rose to 20.5% on September 10, nearing the yearly high of 21.3% at the start of the year.

However, we have seen Bitcoin outperforming Ethereum in the last few days as markets seem to be hedging ahead of the Ethereum Merge on September 15. The rally comes despite the European Central Bank announcing its largest-ever interest rate hike of 75 bps, indicating that further rate rises will be required to curb inflation.
The Ethereum Merge remains the most important narrative in the market. However, macroeconomic conditions seem to have dampened the spirits with the asset struggling to retain any of its gains made in the previous month. Looking forward, we expect markets to bounce back from key support levels as we move toward the Merge day. However, the Merge catalyst is likely to be a ‘sell the news’ event with markets set to trend downwards following the catalyst to reflect the macroeconomic conditions.
Uncertainties remain around the potential Ethereum Proof-of-Work fork as many worry the chain could be prone to replay attacks — an attack where the transactions that are executed on one chain are exploited to be executed on another chain. The ETHW Core announced on Monday that the chain is set to launch 24hrs after the Ethereum Merge.

After years of anticipation, we are finally days away from the Ethereum Merge. The first mention of Ethereum’s transition to a Proof of Stake model can be traced back to months before the launch of the blockchain itself. Vitalik first proposed Slasher — a Proof of Stake algorithm for Ethereum — in January 2014.
Over a year later, Ethereum officially announced its eventual goal to transition to the Proof-of-Stake consensus mechanism in its developer roadmap under the Serenity phase in March 2015 — three months before the launch of the Ethereum network.
2015 to 2018 saw little development in the transition to the Proof of Stake model. Finally, updates were released in 2019 under the project name ETH2, summarizing the different phases required to implement the new consensus algorithm.
In July 2020, the blockchain released the ETH2 Validator launchpad on the testnet. Before long, Ethereum launched the Beacon Chain in December — a new consensus layer that introduced Proof-of-Stake to the blockchain. Later in October 2021, the Beacon Chain underwent its first major upgrade — Altair — which introduced the chain to the Ethereum mainnet.
The merge was ‘rehearsed’ on four separate testnets, starting with the Kiln testnet in March 2022, and concluding with the Goerli testnet on August 11. On August 24, Ethereum announced the Merge date, expected between September 13 and 15. The Bellatrix Upgrade — which prepares the consensus layer to a state ready for the Merge — was completed on September 6.
Finally, after 8 years of research, setbacks, and developments, the Ethereum blockchain completed its switch to a Proof-of-Stake model on September 15.
One of the most critical questions surrounding the Ethereum Merge is whether ETH will remain inflationary or turn into a deflationary asset following the event.
Before the Merge and the implementation of EIP-1559, the upgrade that installed Ethereum’s fee-burning mechanism, ETH issuance came from mining and staking rewards (as of Dec 2020). This kept the annual issuance at around 4.56%.
Since the implementation of EIP-1559, an average of around 6,500 ETH has been burnt daily leading the issuance rate to drop to an average of 2.50% till the beginning of September 2022.
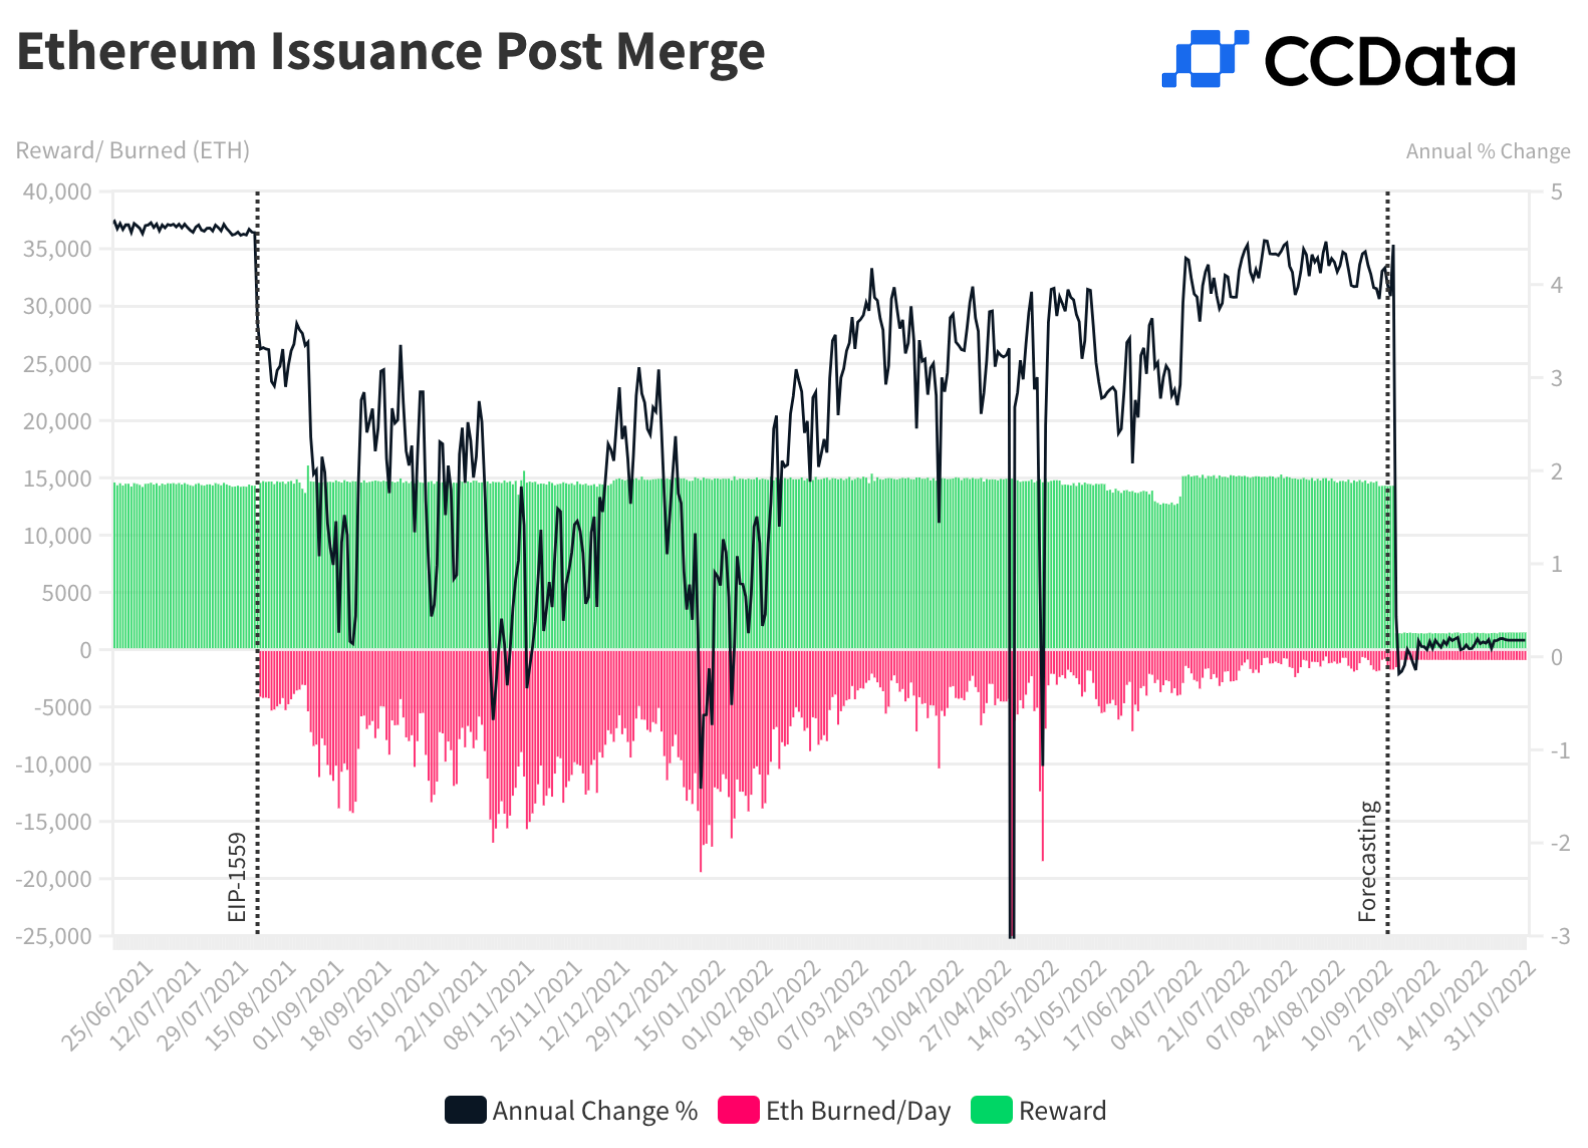
After the Merge, and the successful transfer of Ethereum from Proof of Work (PoW) to Proof of Stake (PoS), the issuance rate is expected to decline by 80% to 90%, with new ETH supply coming only from staking rewards, which are currently on the rise due to an increasing staking yield. Therefore, it is likely that ETH will turn deflationary following the Merge.
Options represent a significant part of the total derivatives volume of Ethereum. Analyzing Ethereum and Bitcoin options, we can see that Ethereum options’ volume has taken over the market, surpassing Bitcoin options’ volume, all while the price of ETH relative to BTC reached new highs in early September.
Moreover, looking into this month’s option contracts, we see an increasing volume of options with expiry dates close to the Merge date

We also find that the Calls to Puts ratio based on expiration dates is higher before the Merge with an average of 3.6, while options with expiry date planned after the Merge have a call to put ratio of 1.79. This suggests that traders are using the Merge as an opportunity to bet on Ethereum, but may sell on the event as the general macro environment remains challenging.


Similarly to options, Ethereum futures volume has witnessed strong momentum over the last two months compared to Bitcoin futures volumes. In September, the ratio of ETH Volumes to BTC volumes reached an average of 0.643, till the 13th of September.
This is a sustained rise from what we typically see in markets — with an average ratio of 0.507 so far this year. This reached a daily high in August at a ratio of 0.771.
Negative funding rates, however, are more prevalent in Ethereum perpetuals than Bitcoin perpetual contracts, amid a bullish price movement last week. We attribute that to traders hedging their spot positions ahead of the uncertainty surrounding the Merge, and the prevailing bearish macro environment.

In Q3, digital assets relating to the Ethereum ecosystem have seen a significant price increase, as these coins and tokens have benefited from The Merge narrative.
This includes layer-2 scaling protocols like Optimism, Polygon and Loopring, but also more far-fetched assets such as the forked Ethereum Classic. The increase occurred despite the total market cap of cryptocurrencies declining by 18% since the beginning of July (up until the 12th of September).
Compared to Bitcoin, Optimism saw a 135% increase followed by Ethereum Classic and Polygon which rose 130% and 70.7% respectively.

All of the insights and visuals created in this blog are powered by CCData’s market-leading digital asset data, spanning 5,500 currency pairs and over 300,000 tokens! This post also utilised our enhanced derivatives and order-book data, which features the most complete and in-depth liquidity data available on the market — all pre-standardised for ease of use
If you’ve enjoyed our latest insights then make sure to follow us on Medium to keep up to date with everything CCData. You can also sign up for our institutional newsletter to receive our insights straight to your inbox.
CCData’s order book product captures the full depth of exchange order books, featuring standardised mapping and post-processing, historical L2 order book data stored for all exchanges, and more. This dataset allows for the development of metrics that can be critical for market participants to assess liquidity, back-test strategies, and decide their exchange venue of choice.
Find out more about our market-leading data offerings here. You can also contact a member of our team for a product demo at https://developers.cryptocompare.com
Disclaimer: Please note that the content of this blog post was created prior to our company's rebranding from CryptoCompare to CCData.
Get our latest research, reports and event news delivered straight to your inbox.